Claude API OpenTelemetry Tracing: How to Set It Up (Beta)
TL;DR
The Claude API now exports OpenTelemetry traces in beta. Set up SDK spans in code, add a Console destination for API spans, and count tokens once.
Last updated: October 17, 2026
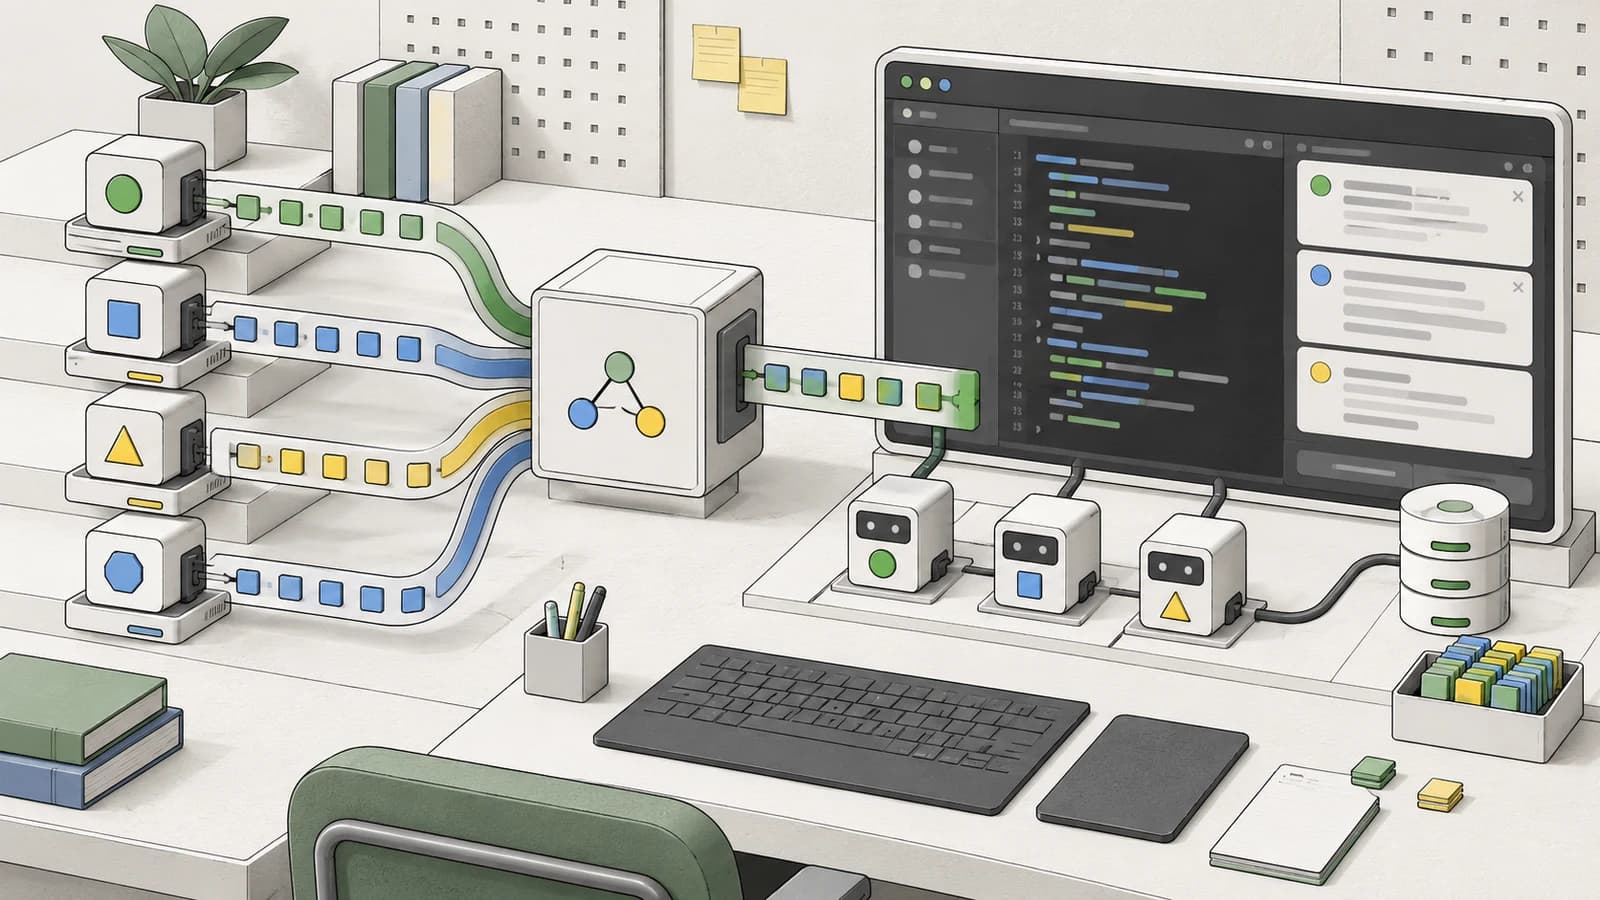
The Claude API can now send OpenTelemetry traces of your Messages API requests and Claude Managed Agents sessions straight to the observability platform you already run. Anthropic shipped it in beta on October 14, 2026. There are two independent halves: SDK tracing, which you turn on in code by registering a tracer provider, and API tracing, which an org admin turns on by adding a destination in the Claude Console. Run both and a single trace shows your own span, the SDK's client span, and the API's server spans for each model request and server tool underneath it.
If you have been stitching together token counts from response headers and a third-party tracing proxy, this is the first-party version. Below is exactly what each half gives you, the setup copied from the official docs, and the two traps (token double counting and content limits) that will bite you on day one.
What shipped#
From the OpenTelemetry overview, the two sources cover different things:
| What you get | SDK tracing | API tracing |
|---|---|---|
| Messages API and Sessions API requests | Yes | Yes |
| Token usage | Yes | Yes |
| Each model run within a request | No | Yes |
| Managed Agents turns | No | Yes |
| Server tools run by the API | No | Yes |
| Client tools run by the tool runner | Yes | No |
| Other API requests, such as file uploads | Yes | No |
| Setup | Code | Console |
| Permission needed | None | Admin |
| Platforms | Any (including Bedrock, Google Cloud, Foundry) | Claude Platform, Claude Platform on AWS |
The spans use the OpenTelemetry GenAI semantic conventions, so platforms that already understand gen_ai.* attributes can render them without custom parsing. The docs list Arize, Braintrust, Databricks, Datadog, Grafana Cloud, Honeycomb, Langfuse, LangSmith, New Relic, PostHog, Sentry and Splunk as partners, but any backend that accepts OTLP works.
This is separate from Claude Code's own telemetry. For Claude Code, the Agent SDK or Cowork, the docs point to Claude Code monitoring instead.
%% title: How one traced Claude API request nests
flowchart TD
  A["Your span: answer_question"] --> B["SDK CLIENT span: anthropic.messages.create"]
  B --> C["API SERVER span: anthropic.messages.create"]
  C --> D["anthropic.model_request"]
  C --> E["Server tool span"]
  C --> F["anthropic.model_request"]
A --> G["SDK span: anthropic.custom_tool_use get_weather"]Step 1: SDK tracing in TypeScript#
Upgrade the SDK and, if your app has no OpenTelemetry setup yet, add the Node trace SDK. These commands are from the SDK setup page:
npm install @anthropic-ai/sdk@latest
npm install @opentelemetry/sdk-trace-node
Register a tracer provider before the first call you want traced. The SDK picks up the registered provider, so your existing messages.create calls do not change. This example follows the official one, adds the per-client options from the same page, and wraps the call in your own span so the SDK span nests under it:
import Anthropic from "@anthropic-ai/sdk";
import { trace } from "@opentelemetry/api";
import {
  ConsoleSpanExporter,
  NodeTracerProvider,
  SimpleSpanProcessor
} from "@opentelemetry/sdk-trace-node";

// Register before the first traced call. register() also installs the
// context manager, so SDK spans nest under your own spans.
const provider = new NodeTracerProvider({
  spanProcessors: [new SimpleSpanProcessor(new ConsoleSpanExporter())]
});
provider.register();

const client = new Anthropic({
  openTelemetry: { tracerProvider: provider, traces: { contentMode: "content" } }
});

const tracer = trace.getTracer("my-service");

await tracer.startActiveSpan("answer_question", async (span) => {
  try {
    const message = await client.messages.create(
      {
        model: "claude-opus-5-5",
        max_tokens: 1024,
        messages: [{ role: "user", content: "Hello, Claude" }]
      },
      { openTelemetry: { conversationId: "conv_42" } }
    );
    console.log(message.content);
  } finally {
    span.end();
  }
});
We type-checked this against @anthropic-ai/sdk 0.135.0, @opentelemetry/sdk-trace-node 2.12.0 and @opentelemetry/api 1.9.1 with tsc --strict. It was not run against the live API. The SDK types contentMode as 'metadata_only' | 'content', so a typo fails at compile time. The console exporter is for seeing spans locally; swap it for an OTLP exporter pointed at your platform before production.
The SDK options, each with an environment variable where one exists:
| Option (TypeScript name) | Environment variable | Default | Use it to |
|---|---|---|---|
traces.contentMode | ANTHROPIC_OPEN_TELEMETRY_TRACES_CONTENT_MODE=content | metadata_only | Include prompts and responses in spans |
traces.maxContentBytes | ANTHROPIC_OPEN_TELEMETRY_TRACES_MAX_CONTENT_BYTES | 0.75 MB | Change the content limit per span |
conversationId | none | none | Link several calls into one conversation (gen_ai.conversation.id) |
tracerProvider | none | the registered provider | Choose which provider gets the spans |
propagation | ANTHROPIC_OPEN_TELEMETRY_PROPAGATION=false | on | Stop sending traceparent and baggage headers |
openTelemetry | ANTHROPIC_OPEN_TELEMETRY=false | on | Turn spans off for one client |
One rule worth memorizing: passing openTelemetry to the client overrides all the ANTHROPIC_OPEN_TELEMETRY* environment variables as a whole. Any nested key you leave out falls back to its default, even if its env var is set. Python, C#, Go, Java, PHP and Ruby SDKs have the same options under their own casing; the SDK page lists each.
Step 2: API tracing with a Console destination#
API tracing needs no code change. What you need, per the API setup page:
- The admin role in the Claude Console organization (developers can view destinations, not add them).
- An OTLP/HTTP endpoint that accepts protobuf at an HTTPS URL on port 443. A self-hosted OpenTelemetry Collector listens on 4318 by default, so put it behind a load balancer or reverse proxy, or configure the receiver for HTTPS on 443.
- Credentials for that endpoint, sent as request headers.
Then open the OpenTelemetry settings page, click Add destination, pick a Provider (or Custom), and enter the base OTLP endpoint URL without /v1/traces - the API appends it. Choose Metadata only or Full content, choose Workspaces (All, Selected or All except), save, then click Test in the destination's More actions menu and look for an anthropic.test span in your backend. Real spans show up under service.name = claude-platform.
If you prefer infrastructure as code, the same destination can be created through the Admin API. This TypeScript call is copied from the docs and type-checks against the same SDK version; it needs an Admin API key in ANTHROPIC_API_KEY:
import Anthropic from "@anthropic-ai/sdk";

const client = new Anthropic();
const destination = await client.beta.organization.telemetryDestinations.create({
  endpoint_url: "https://gateway.example.com/otlp",
  headers: { authorization: "Bearer YOUR_OBSERVABILITY_API_KEY" },
  traces: { content_mode: "metadata_only" },
  workspaces: { type: "all" }
});
console.log(destination.id);
The raw HTTP version is a POST to https://api.anthropic.com/v1/organizations/telemetry_destinations with the anthropic-beta: telemetry-destinations-2026-08-11 header. The ant CLI equivalent is ant --profile admin beta:organization:telemetry-destinations create after ant auth login --profile admin --scope "org:admin".
To nest API spans under your own traces, the API reads the W3C traceparent header on each request. If you set up SDK tracing and call the SDK inside your own span (as in Step 1), that happens automatically.
Gotchas and limits#
Token double counting. When a request has both an SDK span and an API span, both are named anthropic.messages.create. The SDK span is kind CLIENT, its child API span is SERVER. The docs say to sum only one source per request and to use the API spans when both exist. Inside API spans, sum either anthropic.messages.create or its anthropic.model_request children, not both. For Managed Agents, sum anthropic.model_request and anthropic.session.outcome_evaluation. gen_ai.usage.input_tokens already includes cache reads and writes, so do not add the cache attributes on top - this matters if you are tracking the prompt caching savings you think you are getting.
Spans are best effort, not billing. Delivery is at least once (dedupe on trace ID plus span ID) and best effort (a lost span is never re-sent). The docs explicitly say exported spans are not a complete record of usage and point to the Usage API for per-key accounting, including spotting a leaked key.
Content limits. With Full content, each span holds up to 0.75 MB by default, which the docs say fits a 200k-token English context and stays under the 1 MB request limit many platforms impose. Over the limit, anthropic.content.truncated is set to true and request spans drop the system prompt and earliest messages first. A full 1M-token context needs about 4 MB, so raise the limit only if your backend accepts it.
Destinations disable themselves. The API disables a destination on a 3xx redirect, on a hostname that resolves to a non-public IP, or after 24 hours of failed deliveries. Your endpoint gets 5 seconds for the TLS handshake, 5 seconds to send response headers, and 10 seconds per delivery in total. Each org gets 10 destinations, including disabled ones.
TypeScript auto-instrumentation clash. If you use @opentelemetry/instrumentation-undici (included in @opentelemetry/auto-instrumentations-node), set openTelemetry: { propagation: false }. Otherwise a bug in that package adds a second traceparent header and breaks the trace context.
Beta means breaking. The SDK page warns that a new SDK version can rename spans, attributes, options or environment variables during the beta. Pin the SDK version and upgrade on purpose, or your dashboards break silently.
Data leaves Anthropic. Once delivered, spans live under your observability vendor's retention and access controls. With zero data retention you can still use Full content for Messages API requests (held only in memory until delivery); Managed Agents is not ZDR eligible.
The closest alternative#
Before this, the standard route was a proxy or SDK wrapper from a tracing vendor, which we compared in Langfuse vs Braintrust vs Helicone. Those still add evals, prompt management and UI on top. What they cannot see is inside the API: each model run within a request, server tool executions, and Managed Agents turns. If your agent runs on Managed Agents or leans on server tools, the first-party API spans are the only way to see that layer. If you only call the Messages API from your own code, SDK tracing plus your existing backend may be all you need.
What people are actually saying#
- There is no sizeable Hacker News or Reddit thread on the launch yet as of October 17; the discussion so far is vendor-side.
- Several partner platforms on Anthropic's list already have setup guides live, for example Honeycomb, Grafana Cloud and Sentry, which is a decent sign the span schema is usable out of the box.
- The sharpest counter-case comes from Chainloop: they argue these spans are observability, not evidence. Best-effort delivery means you cannot use them to prove what an agent did for audit or compliance, and they pitch signed session records for that job. That matches Anthropic's own "not a complete record" note.
What to do Monday#
- Add
@opentelemetry/sdk-trace-node, register a provider, and confirm oneanthropic.messages.createspan prints to the console. - Swap the console exporter for your OTLP exporter and keep
metadata_onlyuntil you have checked your backend's retention policy. - Ask an org admin to add a Console destination scoped to one workspace, click Test, then widen it.
- Fix your token dashboard to sum one source per request before anyone quotes a cost number from it. If you already watch Claude Code token burn, apply the same discipline here.
FAQ#
How do I get OpenTelemetry traces from the Claude API?#
Upgrade the Claude SDK and register an OpenTelemetry tracer provider before your first call for SDK spans. For API spans, an org admin adds a destination in the Claude Console pointing at an OTLP/HTTP endpoint on HTTPS port 443. Set up both to see client and server spans in one trace.
Do Claude API traces include my prompts and responses?#
Not by default. Metadata only is the default content mode. Switch a destination to Full content, or set the SDK content mode to content, to include prompts and responses. Organizations with a HIPAA, FERPA or K-12 restriction only get metadata from destinations.
Does Claude API OpenTelemetry work on Bedrock or Google Cloud?#
SDK tracing works on any platform the SDK supports, including Amazon Bedrock, Google Cloud and Microsoft Foundry. API tracing through a Console destination is only available on the Claude Platform and Claude Platform on AWS.
Why do my Claude token counts double in my dashboard?#
A request traced by both halves has two anthropic.messages.create spans, one CLIENT and one SERVER. Sum one source per request, and prefer the API spans when both exist.
Continue Reading#
- Langfuse vs Braintrust vs Helicone: Agent Tracing Tools in 2026 - what a dedicated tracing platform adds on top of raw spans
- Claude Managed Agents Public Beta: What's Actually Available vs What's Gated - the runtime whose turns these API spans now expose
- Prompt Caching in the Claude API: A Production Guide - read cache attributes correctly once they are in your traces
Sources#
- Claude Platform release notes, October 14, 2026
- OpenTelemetry for the Claude API
- Set up OpenTelemetry with the Claude SDK
- Set up OpenTelemetry with the Claude API
- OpenTelemetry GenAI semantic conventions
- Claude Code monitoring
- Honeycomb: Send Claude Platform traces
- Chainloop: Our thoughts on Anthropic's OpenTelemetry traces
Get the next deep dive like this in your inbox
One email a week on Anthropic and the rest of the AI dev stack. Free.
Read next on Claude Code
Langfuse vs Braintrust vs Helicone: Agent Tracing Tools in 2026
Langfuse vs Braintrust vs Helicone, plus LangSmith and Arize Phoenix: 2026 pricing tiers, self-host options, agent-trace features, and OpenTelemetry support.
14 min readClaude Managed Agents Public Beta: What's Actually Available vs What's Gated
Claude Managed Agents public beta reviewed: what ships today, which orchestration features are gated behind a research preview, what it costs, and when to DIY.
8 min readClaude Code Token Burn Is an Observability Problem
Claude Code token burn is an observability problem. Why coding agents need cache-hit telemetry, spend ceilings and repro-grade usage logs, not a quota bar.
8 min readTechnical content at the intersection of AI and development. Building with AI agents, Claude Code, and modern dev tools - then showing you exactly how it works.